Preview gallery
About this Skill
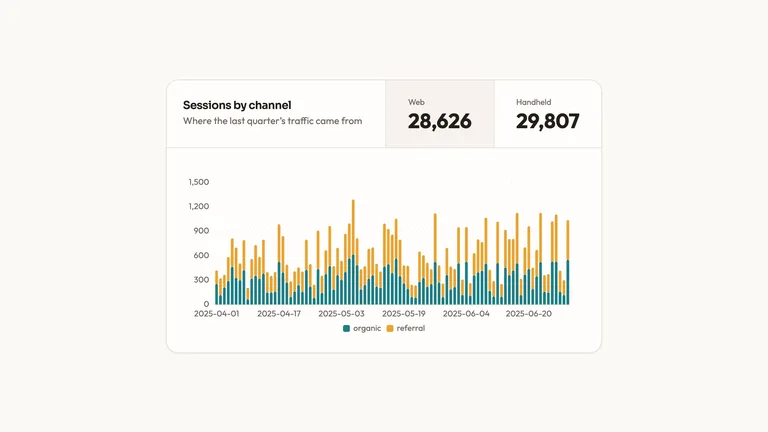
Paired Column Chart is a ready-to-paste data visualization, delivered as editable source with its usage example. It ships with charts drawn through one charting layer, not hand-rolled SVG and a canvas-rendered backdrop that runs without a WebGL library. Colour, type and radius live as tokens you edit once for the whole block.
Picked most often by
About this Skill
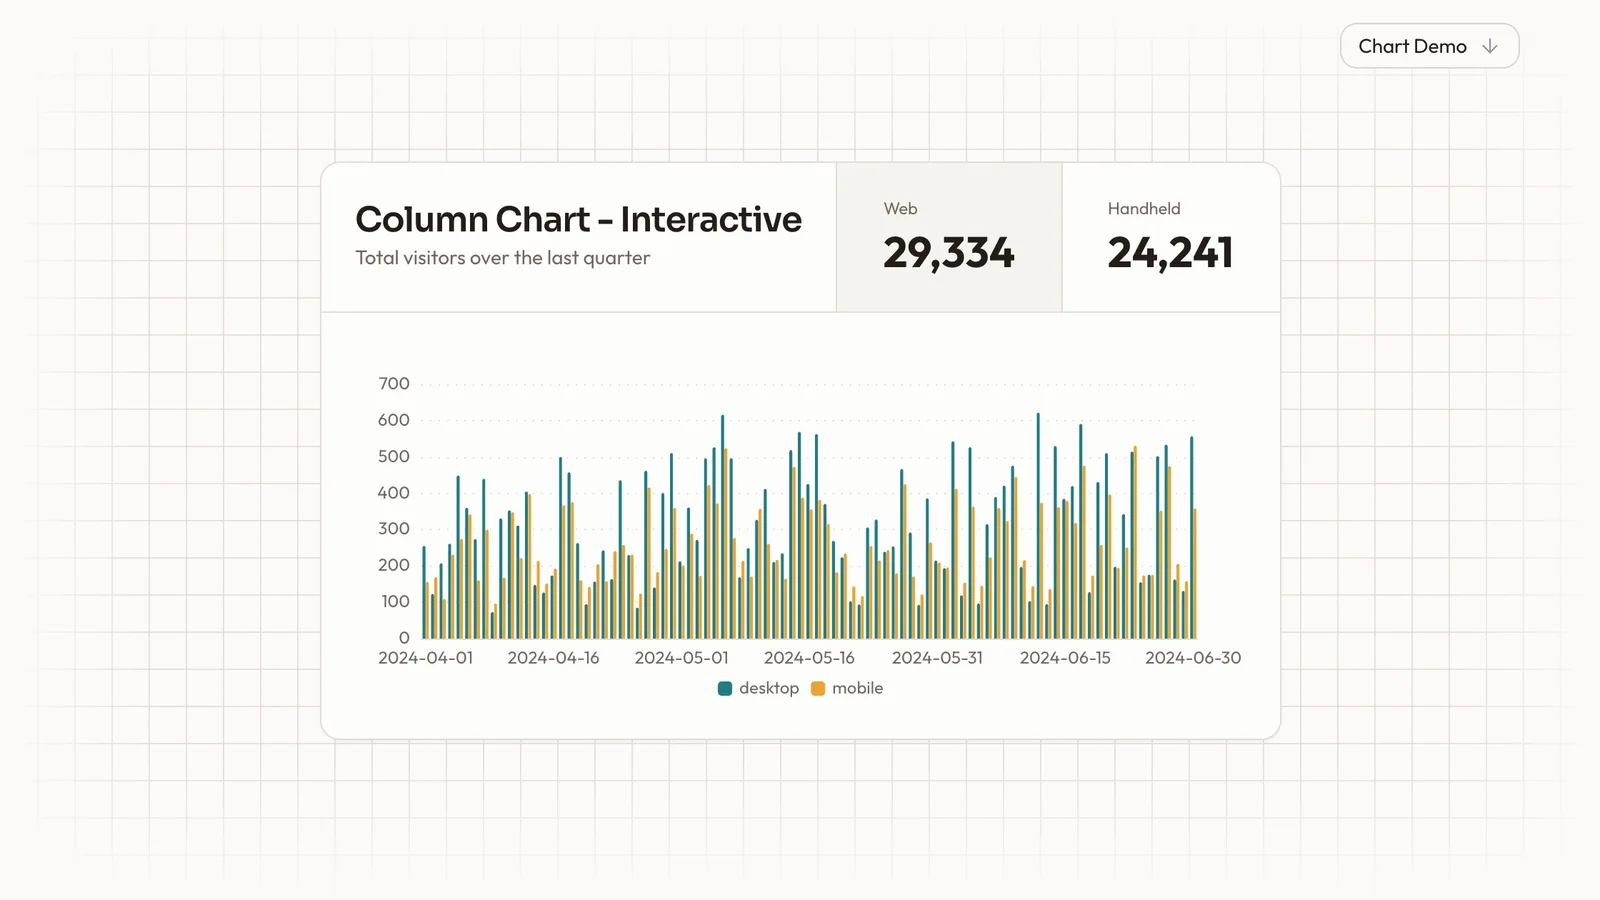
You paste one block and a real data visualization appears on the page, drawn properly rather than sketched in SVG. Put your numbers in and the shapes redraw themselves.
What you get
- The full source for Paired Column Chart — the component file plus a runnable usage example, ready to paste and edit.
- A written visual contract: palette, type scale, radius, icon stroke and motion timings, all as tokens you edit in one place.
- Chart configuration handed over as plain data — swap in your own series and the charting layer handles the rest.
How to use it
- Tell your assistant where the section goes and it reads your project first, then writes the block the way that project is already written.
- Replace the words with yours. The type sizes and spacing hold on their own.
- Swap the numbers for your own series — the chart redraws, colours and axes stay consistent.
- Look at it on a phone before you ship. It is already built to hold there.
What you need before you start
- Dependencies
- ECharts — required
- Last tested
- v1.0.3 — Claude Code / Claude Desktop / Cowork / Codex / ChatGPT
What you get
- The full source for Paired Column Chart — the component file plus a runnable usage example, ready to paste and edit.
- A written visual contract: palette, type scale, radius, icon stroke and motion timings, all as tokens you edit in one place.
- Chart configuration handed over as plain data — swap in your own series and the charting layer handles the rest.
Good fit
- You need a data visualization on a page and would rather not wire up a charting library.
- You want the chart palette and spacing to match the rest of the page.
- You want readable source you can edit, not another dependency to keep upgraded.
Not for
- Teams already running a mature design system — this palette and type scale will fight yours.
- Anyone wanting a versioned npm package; this hands you source to maintain yourself.
- Charts needing live streaming data or virtualised scrolling over very large sets.
Client & Executive ReportingResearch & Technical CommunicationWeb Design & Digital ExperiencesCreate InfographicCreate UI VisualsBuild Website PageEditable OutputVisually PolishedBeginner-friendlyWarm NeutralTeal AccentGenerative Backdrop
User reviews
Loading reviews…